
FINANCIAL STATEMENTS: PARENT COMPANY
STATEMENT OF PROFIT AND LOSSFOR THE PERIOD 1 JANUARY – 31 DECEMBER
| amounts in NOK 1 000 | Note | 2025 | 2024 |
|---|---|---|---|
| Operating revenue and expenses | |||
| Sales revenue | 1,11 | 85 110 | 82 096 |
| Lease revenue | 392 | 520 | |
| Other operating revenue | 0 | 393 | |
| Total operating revenue | 85 502 | 83 009 | |
| Project expenses | -2 711 | -6 | |
| Pay and personnel expenses | 2,3 | -149 150 | -153 478 |
| Depreciation and amortisation | 6 | -412 | -550 |
| Other operating expenses | 2,11 | -49 364 | -52 458 |
| Total operating expenses | -201 637 | -206 492 | |
| Operating profit (loss) | -116 135 | -123 483 | |
| Financial items | |||
| Interest received from group companies | 53 653 | 61 600 | |
| Other interest income | 11 | 20 484 | 16 469 |
| Other financial income | 4 | 295 716 | 332 847 |
| Interest charges paid to group companies | -49 199 | -49 300 | |
| Other interest charges | -6 659 | -7 697 | |
| Other financial costs | 4 | -73 566 | -120 139 |
| Other gains (loss), net | 21 655 | 2 592 | |
| Net financial items | 262 084 | 236 372 | |
| Profit (loss) before income taxes | 145 949 | 112 889 | |
| Income tax (expense) income | 5 | -31 903 | -48 236 |
| Net profit | 114 046 | 64 653 | |
| Profit (loss) for the year | 114 046 | 64 653 | |
| Allocation | |||
| Proposed dividend | 93 766 | 117 207 | |
| Transferred to/from other equity | 20 280 | -52 554 | |
| Total allocation | 114 046 | 64 653 |
FINANCIAL POSITIONAT 31 DECEMBER
| amounts in NOK 1 000 | Note | 2025 | 2024 |
|---|---|---|---|
| Assets | |||
| Non-current assets | - | ||
| Intangible assets | - | ||
| Deferred tax asset | 5 | 783 | 866 |
| Total intangible assets | 783 | 866 | |
| Property, plant and equipment | |||
| Land, buildings and property | 6 | 3 476 | 3 476 |
| Inventory and other equipment | 6 | 813 | 1 225 |
| Total property, plant and equipment | 4 289 | 4 701 | |
| Non-current financial assets | |||
| Investments in subsidiaries | 7 | 1 565 810 | 1 473 298 |
| Investments in associated companies | 7 | 152 890 | 110 239 |
| Other investments | 0 | - | |
| Other receivables | 8,9,10 | 1 098 940 | 1 027 228 |
| Total non-current financial assets | 2 817 640 | 2 610 765 | |
| Total non-current assets | 2 822 712 | 2 616 332 | |
| Current assets | |||
| Receivables | |||
| Trade receivables | 8,9,10, | 17 933 | 6 033 |
| Other receivables from group companies | 10 | 233 392 | 308 007 |
| Other receivables | 5 675 | 10 555 | |
| Total receivables | 257 000 | 324 595 | |
| Cash and cash equivalents | 12 | 715 | 155 500 |
| Total current assets | 257 715 | 480 095 | |
| Total assets | 3 080 427 | 3 096 427 |
FINANCIAL POSITION (CONTINUED)AT 31 DECEMBER
| amounts in NOK 1 000 | Note | 2025 | 2024 |
|---|---|---|---|
| Equity and liabilities | |||
| Paid-in capital | |||
| Share capital | 13,14 | 187 531 | 187 531 |
| Own shares | 14 | -156 | -14 |
| Share premium account | 14 | 1 395 478 | 1 395 478 |
| Other paid-in capital | 14 | 397 776 | 381 153 |
| Total paid-in capital | 1 980 629 | 1 964 148 | |
| Total equity | 1 980 629 | 1 964 148 | |
| Liabilities | |||
| Accrued liabilities | |||
| Pension obligation | 3 | 2 315 | 2 086 |
| Total accrued liabilities | 2 315 | 2 086 | |
| Non-current liabilities | |||
| Non-current interest-bearing liabilities | - | - | |
| Other non-current liabilities | 8,10 | 807 102 | 810 619 |
| Total non-current liabilities | 807 102 | 810 619 | |
| Current liabilities | |||
| Trade payables | 10,11 | 5 426 | 4 511 |
| Current income taxes payable | 5 | 0 | 19 167 |
| Public taxes | 18 128 | 17 820 | |
| Dividend | 14 | 93 766 | 117 207 |
| Intercompany debts | 10 | 144 634 | 131 695 |
| Other current liabilities | 28 427 | 29 174 | |
| Total current liabilities | 290 381 | 319 574 | |
| Total liabilities | 1 099 798 | 1 132 279 | |
| Total equity and liabilities | 3 080 427 | 3 096 427 |
Wrepit PDF: Avoid Page Break Between
Oslo, 18 March 2026
STATEMENT OF CASH FLOWSFOR THE PERIOD 1 JANUARY – 31 DECEMBER
| amounts in NOK 1 000 | Note | 2025 | 2024 |
|---|---|---|---|
| Cash flow from operating activities | |||
| Profit (loss) before income taxes | 145 949 | 112 889 | |
| Write downs of fixed assets | 68 770 | - | |
| Income taxes paid | -19 167 | -62 798 | |
| Depreciation and amortisation | 6 | 412 | 550 |
| Share of (income) losses from associated companies and joint ventures | - | 1 200 | |
| Change in trade receivables | -11 900 | 7 724 | |
| Change in trade payables | 915 | -1 582 | |
| Changes in other working capital* | -230 423 | -187 544 | |
| Proceeds from disposal of tangible and intangible fixed assets | -45 444 | -129 561 | |
| Payments for acquisition of tangible and intangible fixed assets | |||
| Proceeds from disposal of tangible and intangible fixed assets | - | - | |
| Payments for acquisition of tangible and intangible fixed assets | - | -907 | |
| Proceeds from disposal of subsidiaries and associated companies | 44 388 | 200 | |
| Payments for acquisitions of subsidiaries and associated companies | -58 198 | -25 343 | |
| Proceeds from disposal of other investments and repayments on loans given | 41 305 | 53 819 | |
| Payments for acquisition of other investments and loans given | -185 328 | -92 220 | |
| Net cash flow from investing activities | -157 833 | -64 451 | |
| Cash flow from financing activities | |||
| Proceeds from group contribution | 308 007 | 452 851 | |
| Payment of group contribution | -131 695 | -55 451 | |
| Dividends paid to equity holders of Selvaag Bolig ASA | -117 207 | -93 640 | |
| Share buy back Selvaag Bolig ASA | 14 | -27 807 | -23 036 |
| Proceeds from disposal of shares Selvaag Bolig ASA | 17 194 | 18 157 | |
| Net cash flow from financing activities | 48 492 | 298 881 | |
| Net change in cash and cash equivalents | -154 785 | 104 869 | |
| Cash and cash equivalents at 1 January | 155 500 | 50 631 | |
| Cash and cash equivalents at 31 December | 715 | 155 500 | |
| *) Endring i andre tidsavgreningsposter består i hovedsak av nedskrivning av investeringer i datterselskaper og inntektsført konsernbidrag som ikke har kontanteffekt. | |||
ACCOUNTING PRINCIPLES
Accounting principles for Selvaag Bolig ASA
The annual accounts have been compiled in accordance with the Norwegian Accounting Act and Norwegian generally accepted accounting principles (NGAAP).
Use of estimates
The preparation of the accounts pursuant to the Accounting Act requires the use of estimates. Furthermore, the application of the company’s accounting principles requires management to exercise its judgement. Areas where such judgements are extensively applied, where the level of complexity is high, or where assumptions and estimates are significant for the annual accounts are described in the notes.
Sales revenues
Revenues from sales of goods and services are assessed at the fair value of the consideration, net after deduction of VAT. Sales of goods are recorded as income when the company has delivered its products to the customer and no unfulfilled liabilities exist which could influence the customer’s acceptance of the delivery. Provision for expected guarantee work is recorded as a cost and as a provision for liabilities. Services are recorded as income as they are provided.
Classification of balance sheet items
Assets intended for permanent ownership or use are classified as fixed assets. Assets associated with the flow of goods are classed as current assets. Other receivables are classified as current assets if they are to be repaid within one year. Analogue criteria are applied for liabilities. Nevertheless, the first year’s instalment on long-term receivables and liabilities is not classified as a current asset or liability.
Acquisition cost
The acquisition cost of assets comprises the purchase price less bonuses, discounts and the like, plus purchase expenses (freight, customs duty, non-refundable public duties and other direct purchase expenses). Where purchases in foreign currencies are concerned, the asset is capitalised at the exchange rate prevailing at the time of the transaction.
Where tangible fixed assets and intangible assets are concerned, the acquisition cost also includes direct expenses for preparing the asset for use, such as costs for testing the asset. Interest expenses related to the production of fixed assets are expensed.
Intangible assets
Expenses for own development activities are expensed on a continuous basis. Expenses for other intangible assets are capitalised to the extent that it is possible to identify a future financial benefit related to developing an identifiable intangible asset, and the expenses can be measured reliably. In the opposite case, such expenses are expensed on a continuous basis.
Tangible fixed assets
Land is not depreciated. Other tangible fixed assets are capitalised and depreciated on a straight-line basis to their residual value over the expected exploitable lifetime of the asset. In the event of changes to the depreciation plan, the effect is allocated over the remaining depreciation period (the breakpoint method). Maintenance of fixed assets is expensed continuously as operating expenses. Upgrades and improvements are added to the acquisition price of the asset and depreciated in line with the asset. The distinction between maintenance and upgrade/improvement is calculated in relation to the asset’s condition at the time of acquisition.
Leased fixed assets are capitalised as fixed assets if the lease is regarded as financial.
Investments in other companies
With the exception of short-term investments in listed shares, the cost method is used for recording investments in other companies. The cost price is increased when funds are injected in connection with capital expansions or when group contributions are made to subsidiaries. Dividends received are basically recorded as income. Dividends which exceed the share of retained earnings after the acquisition are recorded as a reduction in the acquisition cost. Dividends/group contributions from subsidiaries are recorded in the same year that the subsidiary allocates the amount. Dividends from other companies are recorded as financial income when they are approved.
Impairment of fixed assets
Where there is an indication that the carrying amount of a fixed asset is higher than its fair value, the asset is tested for impairment. This test is performed at the lowest level of fixed assets which has independent cash flows. If the carrying amount is higher than both the sales value and the recoverable amount (present value in continued use/ownership), the asset is written down to the higher of sales value or recoverable amount.
Earlier impairments, with the exception of impaired goodwill, are reversed if the requirements for impairment are no longer present.
Inventory and buildings under construction
Goods are assessed at the lower of acquisition cost (on the FIFO principle) and fair value. The cost price of manufactured products includes direct material and payroll costs with the addition of a relative share of indirect costs.
When developing homes on its own account, the company uses the percentage of completion method, where the recording of project profit as income is limited to the relative share of the project which has been sold.
The practical consequence of the accounting policy applied is that total project costs incurred during the life of the project are expensed as cost of sales and the project value (costs plus share of profit) is recorded as income and capitalised on the balance sheet. Project value less payments from customers is normally recorded as work in progress. If payments from customers exceed the contractual income earned, the excess is recorded as advances from customers.
When the project is completed, the cost price of unsold homes is transferred to inventory and thereby reduces operating revenues and expenses by the cost price of the unsold homes. In certain circumstances at the termination of the project, this can result in low or negative operating income/cost of sales in the company’s annual accounts.
Construction contracts
Work in progress related to fixed-price contracts with a long production life is assessed using the percentage of completion method. The degree of completion is calculated as costs incurred as a percentage of the expected total cost. The total cost is reassessed continuously. Where a project is expected to show a loss, the whole loss is expensed immediately.
Receivables
Accounts receivable are capitalised on the balance sheet after deduction of the provision for expected loss. Provision for loss is made on the basis of an individual assessment of the receivables and a supplementary provision to cover other expected loss. Significant financial problems at the customer, the probability that the customer will go into liquidation or enter a financial restructuring, and delays and shortfalls in payments are regarded as indicators that the receivable must be written down.
Other receivables, both current and long-term, are recorded at the lower of face value and fair value. Fair value is the present value of expected future payments. Nevertheless, no discounting is done when the effect of discounting is insignificant for the accounts. Provision for loss is assessed in the same way as accounts receivable.
Foreign currency
Receivables and liabilities in foreign currencies are assessed at the exchange rate prevailing at the end of the accounting year. Exchange rate gains and losses related to the sale and purchase of goods in foreign currencies are recorded as sales income and cost of sales.
Liabilities
Loans are initially recorded at fair value less transaction costs. They are then measured at amortised cost, with differences between the loan paid out (less transaction costs) and the redemption value recorded in the profit and loss account over the term of the loan using the effective interest rate method.
Loans are classified as current unless the group has an unconditional right to defer settlement of the liability for at least 12 months after the end of the reporting period.
Guarantee work/claims
Guarantee work/claims related to completed sales are assessed at the estimated cost of such work. The estimate is calculated on the basis of historical figures for guarantee work, but corrected for expected variance because, for example, of changes in quality assurance routines and the product range. The provision is recorded in other short-term liabilities, and the change in the provision is expensed.
Pensions
Pensions are accounted for in accordance with the Norwegian Accounting Standard on pension expenses. Defined contribution pension plans are accrued using the matching principle. Contributions for the year to the pension scheme are expensed. Early retirement commitments under the Norwegian Confederation of Trade Unions/Confederation of Norwegian Enterprise (LO/NHO) AFP scheme relate to a defined benefit multi-enterprise plan, but are recorded as a defined contribution plan since they are not measurable.
Tax
Tax expense in the profit and loss account includes both tax payable for the period and the change in deferred tax. Deferred tax is calculated using relevant tax rates on the basis of temporary differences arising between accounting and tax values as well as possible tax-related losses for carrying forward at the end of the accounting year. Temporary tax-increasing and tax-reducing differences which reverse or could reverse in the same period are offset. Recording deferred tax benefit on net tax-reducing differences which are not offset and losses for carrying forward is justified on the basis of expected future earnings. Deferred tax and tax benefit which can be capitalised are recorded net on the balance sheet.
Tax reduction on group contribution paid, and tax on group contribution received which is applied to reducing the acquisition price or directly against equity, are applied directly against tax on the balance sheet (against tax payable if the group contribution has an effect on tax payable and against deferred tax if the group contribution has an effect on deferred tax).
Deferred tax is recorded at the nominal amount.
Cash flow statement
The cash flow statement is compiled using the indirect method. Cash and cash equivalents include cash, bank deposits and other short-term liquid investments which can be converted immediately and without significant price risk to known cash amounts and with a remaining term of less than three months from the acquisition date.
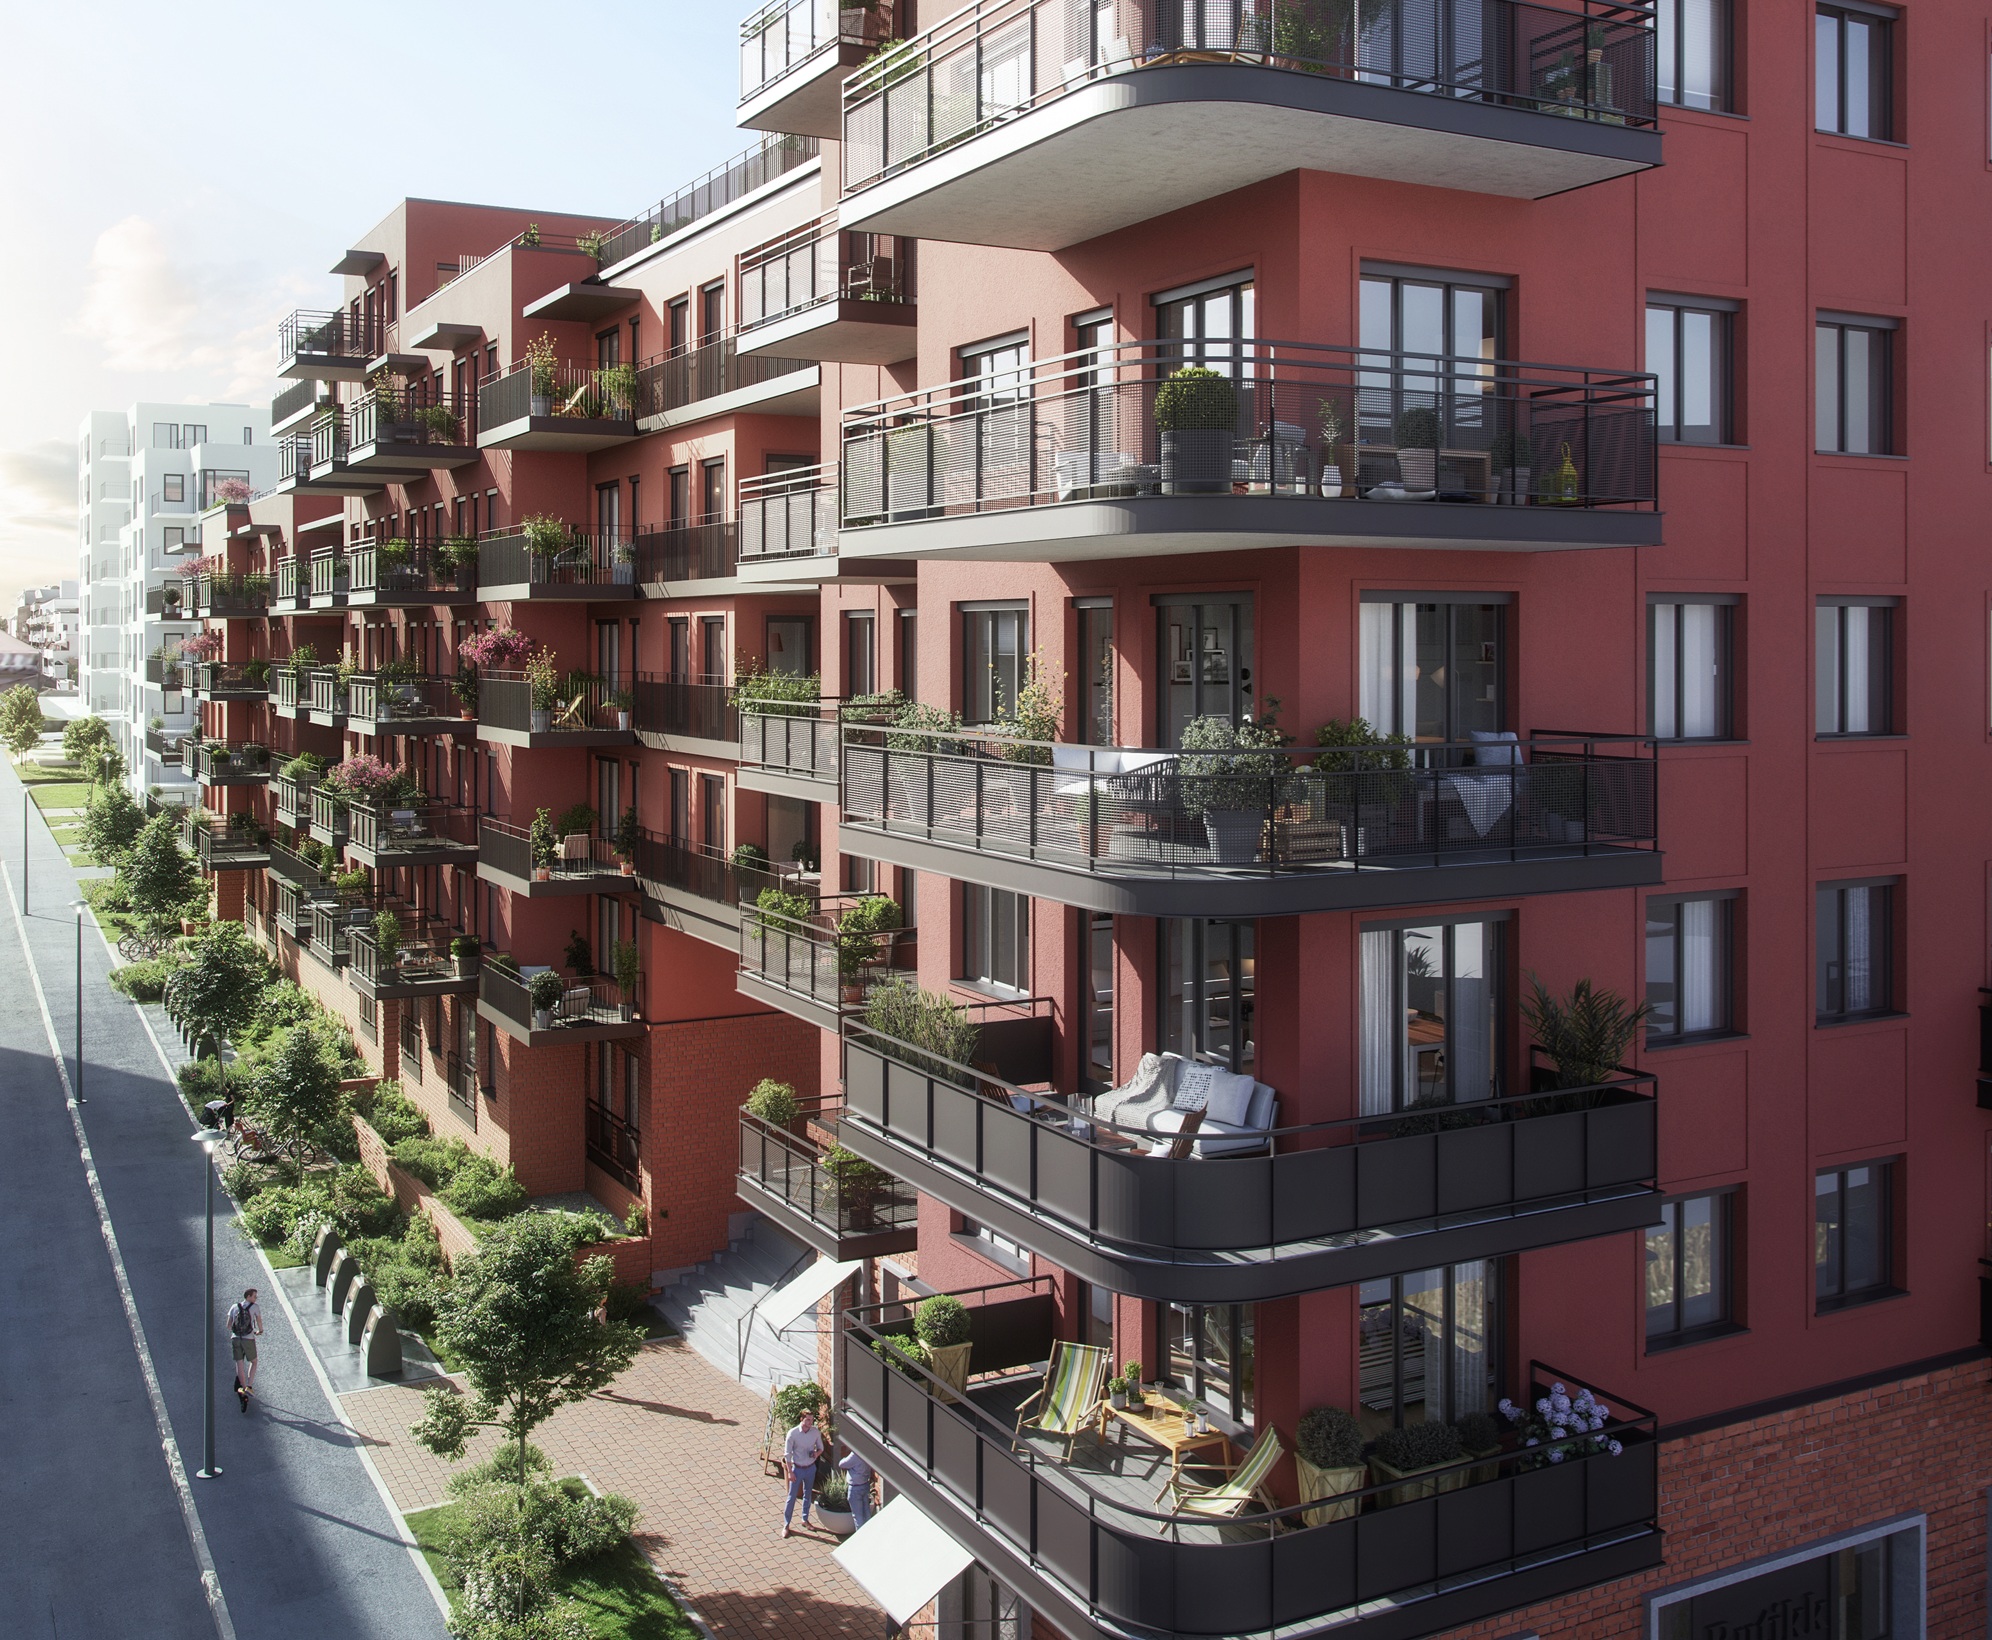
Lille Løren Park, Oslo
NOTES
Note 1 REVENUE
| Specification of revenue | 2025 | 2024 |
|---|---|---|
| Project management and business management | 57 474 | 48 643 |
| Other revenue | 27 636 | 33 453 |
| Total | 85 110 | 82 096 |
The revenues are from Norway.
Note 2 PAYROLL COSTS, NUMBER OF EMPLOYEES, REMUNERATION, LOANS TO EMPLOYEES, ETC
| Pay and personnel expenses | 2025 | 2024 |
|---|---|---|
| Wages and salaries | 118 662 | 118 767 |
| Social security tax | 17 967 | 21 199 |
| Pension costs | 5 771 | 5 802 |
| Other benefits | 6 750 | 7 710 |
| Total | 149 150 | 153 478 |
| Average number of employees | 2025 | 2024 |
|---|---|---|
| 57 | 56 |
| Salary | Bonus | Share purchase programme | Pension | Other | Total | |
|---|---|---|---|---|---|---|
| Remuneration to CEO - Sverre Molvik | 4 280 | 3 979 | 1 850 | 127 | 259 | 10 495 |
The company has a share savings programme for the company's employees who work more than 50 per cent and a share purchase programme for senior employees, as discussed in point 3 in the section on corporate governance. In 2025, a discount of NOK 6 702 000 was given to employees when purchasing shares (NOK 7 153 000 in 2024). The discount is included in the payroll costs.
For remuneration of other members of the group management and shares owned by these and by directors, see the executive pay report published on the company’s website.
NOK 2 817 000 has been paid in director’s fees in 2025.
| Fees paid to the auditor | 2025 | 2024 |
|---|---|---|
| Statutory audit services (incl technical support with the annual accounts) | 1 848 | 1 606 |
| Other assurance services | 218 | 325 |
| Other assurance services | - | - |
| Other non-audit services | - | - |
| Total fees paid to the auditor | 2 066 | 1 931 |
Note 3 PENSIONS
Selvaag Bolig ASA is required to offer an occupational pension plan in line with the Act on Mandatory Occupational Pensions ("lov om obligatorisk tjenestepensjon" or OTP). The company has a pension plan which meets these requirements.
Defined contribution plan
Selvaag Bolig ASA has a defined contribution plan for all employees.
Early retirement pension (AFP)
The Company participates in the contractual early retirement pension scheme (AFP), which covers 65 employees. The scheme, established at 1 January 2011, is a multi-employer defined benefit plan but is accounted for as a defined contribution plan as sufficient information to recognise the company’s proportionate share of the defined benefit obligation, plan assets and pension cost is not available. Contributions to the scheme are recognised as pension expense when incurred. Accordingly, no liability is recognised in the statement of financial position.
The AFP obligation from the previous plan was included as debt and was taken to income in 2010, except for the obligation related to expected payments to cover the remaining shortfall in the old AFP plan.
Other non-vested plans
The company also has other non-vested pension plans where the obligation is estimated and accounted for annually.
| Pension costs | 2025 | 2024 |
|---|---|---|
| Pension cost - IBP/UFP | 4 784 | 4 782 |
| Other pension cost (incl AFP) | 987 | 1 020 |
| Net pension cost | 5 771 | 5 802 |
| Pension obligations | 2025 | 2024 |
|---|---|---|
| Early retirement pension (AFP) | - | - |
| Other pension plans | 2 315 | 2 086 |
| Net pension obligations | 2 315 | 2 086 |
| Economic assumptions | ||
|---|---|---|
| Members in non-vested plans | 1 | 1 |
| Discount rate | 4,00% | 3,90% |
| Future increase in salaries/pensions | 4,00% | 4,00% |
| Future increase in National Insurance base amount | 3,75% | 3,75% |
| Expected share of pension withdrawal through the AFP plan | 50,00% | 50,00% |
Note 4 OTHER FINANCIAL INCOME AND EXPENSES
| Specification of other financial expenses | 2025 | 2024 |
|---|---|---|
| Write-downs | 300 | 1 200 |
| Currency | 61 | 7 |
| Write-downs, shares in subsidiaries | 68 470 | 118 862 |
| Other financial expenses (guarantees and amortisised cost, etc) | 4 735 | 69 |
| Total | 73 566 | 120 139 |
Other financial income of NOK 295.7 million (NOK 332.8 million) consists of group contributions from subsidiaries of NOK 233.2 million (NOK 307.8 million) and dividends from joint ventures of NOK 62.5 million (NOK 25 million).
Note 5 INCOME TAXES
| Deferred tax assets and liabilities | 2025 | 2024 |
|---|---|---|
| Temporary differences | ||
| Non-current assets | -2 304 | -2 677 |
| Net pension funds/obligations | -2 315 | -2 086 |
| Accruals | 1 059 | 825 |
| Net temporary differences | -3 559 | -3 938 |
| Base for deferred tax asset | -3 559 | -3 938 |
| 22% deferred tax asset | -783 | -866 |
| Deferred tax (asset) in the balance sheet | -783 | -866 |
Deferred tax assets are fully recognised as the company expects the position to be utilised against future profits.
| Base for tax expense, change in deferred tax and taxes payable | 2025 | 2024 |
|---|---|---|
| Profit (loss) before income taxes | 145 949 | 112 889 |
| Permanent differences | -937 | 106 366 |
| Base for tax income (expense) | 145 012 | 219 255 |
| Change in temporary differences | -379 | -439 |
| Base for income tax payable | 144 634 | 218 816 |
| Changes in equity with effect on taxes | - | - |
| Group contribution given | -144 634 | -131 695 |
| Use of loss carried forward | - | - |
| Taxable income (base for tax payable in the balance sheet) | - | 87 121 |
| Specification of income tax expense | 2025 | 2024 |
|---|---|---|
| Current income taxes payable | - | 19 166 |
| Taxes payable from group contribution recognised against investment in subsidiaries | - | - |
| Tax effect from group contribution given | 31 819 | 28 973 |
| Income tax before change in deferred tax | 31 819 | 48 139 |
| Change in deferred tax | 84 | 97 |
| Income taxes in profit (loss) | 31 903 | 48 236 |
| Taxes payable | 2025 | 2024 |
|---|---|---|
| Taxes payable (22% of base for taxes payable in profit (loss) | 31 819 | 48 140 |
| Taxes payable from group contribution given | -31 819 | -28 973 |
| Taxes payable | - | 19 167 |
| Reconciliation from nominal to effective income tax rate | 2025 | 2024 |
|---|---|---|
| 22% profit (loss) before tax | 32 109 | 24 836 |
| Permanent differences (22%) | -206 | 23 400 |
| Total | 31 903 | 48 236 |
| Reconciliation of deferred tax asset | 2025 | 2024 |
|---|---|---|
| Deferred tax (asset) at 1 January | -866 | -963 |
| Change in deferred tax | 83 | 97 |
| Net deferred tax liabilities (assets) at 31 December | -783 | -866 |
Note 6 FIXED ASSETS
| Fixed assets | Land | Inventory and other equipment | Total |
|---|---|---|---|
| Cost at 1 January | 3 476 | 23 096 | 26 572 |
| Additions | - | - | - |
| Disposals | - | - | - |
| Cost at 31 December | 3 476 | 23 096 | 26 572 |
| Accumulated depreciation | - | 22 283 | 22 283 |
| Accumulated write-downs | - | - | - |
| Carrying amount at 31 December | 3 476 | 813 | 4 289 |
| Depreciation current year | - | 412 | 412 |
Land is not depreciated. Inventory and other equipment are depreciated over three to five years on a straight-line basis.
The company rents offices at Silurveien 2 that are not capitalised. The lease runs until 31 December 2033 and may be extended for a further five years. Annual rent is NOK 3.8 million excluding VAT and is indexed annually to Statistics Norway’s Consumer Price Index.
Note 7 SUBSIDIARIES, ASSOCIATED COMPANIES AND JOINT VENTURES
| Subsidiary | Registered office | Ownership and voting power | Equity last year (100 %) | Profit and loss last year (100 %) | Carrying amount | |
|---|---|---|---|---|---|---|
| Selvaag Pluss AS | Oslo | 100% | 152 429 | 2 641 | 189 469 | |
| Selvaag Bolig Sandsliåsen AS | Bergen | 100% | 34 756 | -1 980 | 40 722 | |
| Sandsliåsen Utbygging AS | Bergen | 100% | 12 109 | -567 | 49 964 | |
| Sandsliåsen 46 Utbygging AS | Bergen | 100% | 1 435 | -563 | 3 964 | |
| Selvaag Boligutvikling I AS | Oslo | 100% | 16 430 | -349 | 16 300 | |
| Selvaag Bolig Vestby AS | Oslo | 100% | 3 059 | -41 | 2 992 | |
| Selvaag Eiendomsoppgjør AS | Oslo | 100% | 1 416 | -1 802 | 1 415 | |
| Selvaag Bolig Lilleaker AS | Oslo | 100% | 5 172 | -1 222 | 21 864 | |
| Selvaag Bolig Lørenskog AS | Oslo | 100% | 21 433 | -5 657 | 150 053 | |
| Selvaag Bolig Grenseveien AS | Oslo | 100% | 35 338 | 29 924 | 38 613 | |
| Selvaag Bolig Bjerke AS | Oslo | 100% | 26 896 | -682 | 31 058 | |
| Selvaag Bolig Langhus AS | Oslo | 100% | 1 684 | 21 125 | 4 000 | |
| Selvaag Bolig Solberg AS | Oslo | 100% | 14 050 | 1 427 | 15 000 | |
| Selvaag Løren 7 AS | Oslo | 100% | 7 866 | -629 | 71 586 | |
| Selvaag Bolig Hamang AS | Oslo | 100% | 40 864 | 3 093 | 40 500 | |
| Selvaag Bolig Rogaland AS | Stavanger | 100% | 235 028 | -19 314 | 300 000 | |
| Selvaag Pluss Eiendom KS 1) | Oslo | 67% | 245 360 | 8 760 | 201 526 | |
| Selvaag Bolig Ballerud AS | Oslo | 100% | 48 309 | -3 037 | 60 295 | |
| Selvaag Bolig Avløs AS | Oslo | 100% | 1 000 | -33 | 1 000 | |
| Selvaag Bolig Tomt II AS | Oslo | 100% | 443 | -31 | 440 | |
| Selvaag Bolig Landås AS | Oslo | 100% | 11 586 | -5 553 | 44 980 | |
| Øya Lervig Brygge AS | Stavanger | 100% | 2 560 | 102 | 2 500 | |
| Selvaag Bolig Sandslihaugen 30 AS | Oslo | 100% | 5 499 | -508 | 6 665 | |
| Selvaag Bolig Torvmyra AS | Trondheim | 100% | 6 281 | -47 | 8 268 | |
| Selvaag Bolig Lørenporten AS | Oslo | 100% | 28 626 | 1 512 | 22 259 | |
| Selvaag Bolig Trævarefabrikken AS | Oslo | 100% | 8 068 | 368 | 7 680 | |
| Vestparken AS | Oslo | 100% | 12 783 | 386 | 12 168 | |
| Skårer Bolig AS | Oslo | 100% | 96 167 | 35 674 | 15 216 | |
| Lørenskog Sentrum Vest AS | Oslo | 100% | -155 | 1 601 | 68 590 | |
| Selvaag Bolig Skalstadskogen AS | Oslo | 100% | 10 127,80 | -13,53 | 5 605 | |
| Selvaag Bolig Bjørnåsen Syd II AS | Oslo | 100% | 486,73 | -556,38 | 485 | |
| Selvaag Bolig Rådhushagen AS | Oslo | 100% | 1 423,84 | -187,77 | 506 | |
| Selvaag Bolig Mellomåsveien AS | Oslo | 100% | 6 741,07 | -477,90 | 7 218 | |
| Selvaag Bolig Løren 5 AS | Oslo | 100% | 2 059,03 | -6,55 | 1 961 | |
| Selvaag Bostad AB | Stockholm | 100% | 97 550 | -4 881 | 120 950 | |
| Carrying amount at 31 December | 1 565 810 | |||||
| 1) The company is owned 66.7% by the parent company and 33.3% by a subsidiary | ||||||
| Associated company | Registered office | Ownership and voting power | Equity last year (100 %) | Profit and loss last year (100 %) | Carrying amount | |
|---|---|---|---|---|---|---|
| Tiedemannsfabrikken AS | Oslo | 50% | 3 844 | 3 230 | 100 | |
| Sinsenveien Utvikling AS | Oslo | 50% | 124 | 123 866 | 25 | |
| Heimdal Stasjonsby AS | Trondheim | 50% | 9 363 | -489 | 4 600 | |
| Fornebu Sentrum Utvikling AS | Oslo | 50% | -28 138 | -92 | 5 016 | |
| Haakon VII's gate 4 Utvikling AS | Trondheim | 50% | 3 017 | -3 772 | 25 | |
| Kaldnes Brygge AS | Tønsberg | 50% | 50 122 | 4 857 | 46 000 | |
| Kanalveien Utvikling AS | Bergen | 50% | -10 684 | -6 348 | 1 436 | |
| Kanalveien 51-53 AS | Bergen | 50% | -6 827 | -2 061 | 15 | |
| Rabekkgata 4-6 AS | Oslo | 50% | 56 018 | 62 | 65 643 | |
| Sandsliåsen 40 Utvikling AS | Bergen | 50% | -8 | -38 | 15 | |
| Glassverket Boligutvikling AS | Oslo | 50% | 45 | 15 | 15 | |
| Verftsbyen Bolig AS | Oslo | 50% | 42 745 | -138 | 30 000 | |
| Carrying amount at 31 December | 152 890 |
| Subsidiaries owned via other subsidiaries | Registered office | Ownership and voting power |
|---|---|---|
| Aase Gaard AS | Stavanger | 100% |
| Nordic Residential SL | Spain | 100% |
| Jaasund AS | Stavanger | 100% |
| Lade Alle 67-69 Holding AS | Oslo | 100% |
| Lervig Brygge AS | Stavanger | 100% |
| Nesttun Pluss Komplementar AS | Oslo | 75% |
| Nesttun Pluss KS | Oslo | 75% |
| Nyhavn Pluss AS | Oslo | 100% |
| Selvaag Bolig Pallplassen AS | Oslo | 100% |
| Selvaag Bolig Formtoppen AS | Oslo | 100% |
| Selvaag Bolig Vinterportalen AS | Oslo | 100% |
| Selvaag Bolig Vaagen AS | Stavanger | 100% |
| Selvaag Pluss International Holding AS | Oslo | 100% |
| Selvaag Pluss Service AS | Oslo | 100% |
| Selvaag Pluss Service AB | Sverige | 100% |
| Selvaag Bolig Bispelua AS | Oslo | 100% |
| Strandkanten Pluss II AS | Oslo | 100% |
| Selvaag Bolig Bjerke Næring AS | Oslo | 100% |
| Selvaag Bostad Entreprenad AB | Stockholm | 100% |
| Selvaag Bostad Holding AB | Stockholm | 100% |
Investments in subsidiaries, associated companies and joint ventures are accounted for using the cost method.
Note 8 RECEIVABLES AND LIABILITIES
| Trade receivables | 2025 | 2024 |
|---|---|---|
| Trade receivables nominal value | 17 933 | 6 033 |
| Allowance for doubtful debts | - | - |
| Net trade receivables | 17 933 | 6 033 |
| Non-current liabilities due beyond five years | 2025 | 2024 |
|---|---|---|
| Other non-current debts to group companies | 751 459 | 810 619 |
| Total | 751 459 | 810 619 |
| Maturity schedule for non-current loans: | ||
|---|---|---|
| To be repaid during 2026 | - | - |
| To be repaid during 2027 | - | - |
| To be repaid during 2028 | - | - |
| To be repaid during 2029 | - | - |
| To be repaid during 2030 or later | 751 459 | 810 619 |
| Total | 751 459 | 810 619 |
| Pledged debts | 2025 | 2024 |
|---|---|---|
| Debt | - | - |
| Carrying amount of land pledged as security on bank loans | 2025 | 2024 |
|---|---|---|
| Shares in subsidiaries | 153 006 | 139 533 |
Note 9 RECEIVABLES FROM ASSOCIATED COMPANIES AND JOINT VENTURES
| Current | Non-current | |||
|---|---|---|---|---|
| 2025 | 2024 | 2025 | 2024 | |
| Kaldnes Brygge AS | 9 | - | - | - |
| Dockside Næring AS | 14 | - | - | - |
| Sinsenveien Utvikling AS | 2 612 | 3 504 | - | - |
| Sandsliåsen 40 Utvikling AS | - | - | 2 305 | - |
| Rabekkgata 4-6 AS | - | - | 1 602 | - |
| Heimdal Stasjonsby AS | 10 | - | - | 13 250 |
| Haakon VIIs gate 4 Utvikling AS | -278 | - | 35 660 | 26 976 |
| Fornebu Sentrum Utvikling AS | 17 | - | 140 220 | 111 110 |
| Sandnes Eiendom Holding AS | - | - | 16 275 | 15 252 |
| Elveparken Sandnes AS | 103 | 103 | - | - |
| Glassverket Boligutvikling AS | - | - | 2 027 | - |
| Verftsbyen Bolig AS | 76 | 1 | - | - |
| Kanalveien 51-53 AS | - | - | 21 786 | 15 524 |
| Kanalveien Utvikling AS | 8 643 | - | 1 011 | 11 070 |
| Total | 11 207 | 3 608 | 220 885 | 193 182 |
Note 10 INTERCOMPANY BALANCES
| Trade receivables | Other receivables | |||
|---|---|---|---|---|
| Current receivables | 2025 | 2024 | 2025 | 2024 |
| Group companies | 6 051 | 1 978 | 233 314 | 308 007 |
| Total | 6 051 | 1 978 | 233 314 | 308 007 |
| Receivables due in more than one year | 2025 | 2024 |
|---|---|---|
| Group companies | 869 862 | 821 753 |
| Total | 869 862 | 821 753 |
| Other current liabilities | ||||
|---|---|---|---|---|
| Trade liabilities | Other current liabilities | |||
| Current liabilities | 2025 | 2024 | 2025 | 2024 |
| Group companies | - | - | 144 634 | 131 695 |
| Total | - | - | 144 634 | 131 695 |
| Other non-current liabilities | ||
|---|---|---|
| Liabilities due in more than one year | 2025 | 2024 |
| Group companies | 751 459 | 810 619 |
| Total | 751 459 | 810 619 |
Note 11 RELATED-PARTY TRANSACTIONS
| Sale of goods and services | 2025 | 2024 |
|---|---|---|
| Associated companies and joint ventures | 39 780 | 38 114 |
| Other related parties (including subsidiaries and joint ventures of parent company) | 554 | 607 |
| Purchase of goods and services | 2025 | 2024 |
|---|---|---|
| Selvaag AS (parent company) | 543 | 543 |
| Other related parties (including subsidiaries and joint ventures of parent company) | 7 682 | 7 290 |
| Financial income | 2025 | 2024 |
|---|---|---|
| Selvaag AS (parent company) | - | - |
| Associated companies and joint ventures | 14 552 | 13 706 |
Outstanding balances at 31 December:
| Receivables | 2025 | 2024 |
|---|---|---|
| Selvaag AS (parent company) | - | - |
| Other related parties (including subsidiaries and joint ventures of parent company) | 550 | 348 |
| Debt | 2025 | 2024 |
|---|---|---|
| Other related parties (including subsidiaries and joint ventures of parent company) | 2 356 | 2 006 |
Goods and services sold to related parties are sold at the same prices and terms as to external third parties. Administrative services are purchased from the parent company on market-based terms.
In addition, the company sold its share of a joint venture project in Ski to Urban Property Eier AS for NOK 44.4 million.
Details of transactions between Selvaag Bolig ASA and other related parties are specified above. Intercompany balances and transactions between Selvaag Bolig ASA and its subsidiaries, which are related parties to the company, are not included here.
Note 12 RESTRICTED BANK ACCOUNTS
The company had no restricted bank accounts at 31 December 2025.
Note 13 SHARE CAPITAL AND SHAREHOLDERS
| The 20 largest shareholders at 31 December 2025 | Number of shares | Ownership |
|---|---|---|
| SELVAAG AS | 50 180 087 | 53,5 % |
| Skandinaviska Enskilda Banken AB | 4 980 572 | 5,3 % |
| PERESTROIKA AS | 3 848 312 | 4,1 % |
| VERDIPAPIRFONDET ALFRED BERG GAMBA | 2 706 726 | 2,9 % |
| The Northern Trust Comp, London Br | 2 186 000 | 2,3 % |
| EGD CAPITAL AS | 1 704 752 | 1,8 % |
| SANDEN EQUITY AS | 1 660 000 | 1,8 % |
| HAUSTA INVESTOR AS | 1 600 000 | 1,7 % |
| MUSTAD INDUSTRIER AS | 1 067 454 | 1,1 % |
| The Northern Trust Comp, London Br | 840 200 | 0,9 % |
| Sverre Molvik | 759 852 | 0,8 % |
| Øystein Klungland | 759 852 | 0,8 % |
| Brown Brothers Harriman & Co. | 684 331 | 0,7 % |
| MATTISHOLMEN AS | 578 939 | 0,6 % |
| VERDIPAPIRFONDET ALFRED BERG NORGE | 505 298 | 0,5 % |
| Brown Brothers Harriman & Co. | 486 006 | 0,5 % |
| Christopher Brunvoll | 446 634 | 0,5 % |
| SKEIE ALPHA INVEST AS | 430 000 | 0,5 % |
| KBC Bank NV | 386 569 | 0,4 % |
| VARDE NORGE AS | 383 395 | 0,4 % |
| Total 20 largest shareholders | 76 194 979 | 81,3 % |
| Other shareholders | 17 570 709 | 18,7 % |
| Total number of shares | 93 765 688 | 100,0 % |
| *) Further information on shareholders is presented at: http://sboasa.no/en/ | ||
The share capital of NOK 187 531 376 comprised 93 765 688 shares with a par value of NOK 2.00. Selvaag Bolig ASA held 71 504 of its own shares at 31 December 2025 (341 own shares at 31 December 2024). These had a nominal value of NOK 143 000 (roughly NOK 1 000 in 2024). For background on the acquisition of treasury shares, see the description of the share purchase programme and the share savings programme in item 3 of the corporate governance section. For changes in the holding of treasury shares, see note 13 “Share capital and shareholder” in the consolidated financial statements.
Note 14 EQUITY
| Changes in equity | Share capital | Own shares | Share premium account | Other paid-in capital | Total |
|---|---|---|---|---|---|
| Equity 1 January | 187 531 | -14 | 1 395 478 | 381 153 | 1 964 148 |
| Share buy back | - | -1 600 | - | -26 207 | -27 807 |
| Sale of own shares | - | 1 458 | - | 22 549 | 24 007 |
| Net income/(loss) for the period | - | - | - | 114 046 | 114 046 |
| Accrued dividend | - | - | - | -93 766 | -93 766 |
| Equity at 31 December | 187 531 | -156 | 1 395 478 | 397 776 | 1 980 629 |
Note 15 CONTINGENT LIABILITIES AND GUARANTEES
| Selvaag Bolig ASA has provided the following guarantees: | Amount |
|---|---|
| Tax guarantee | 7 000 |
| Guarantees related to loans to subsidiaries ("Selvskyldnergaranti") | 822 126 |
| Construction client guarantee | 324 276 |
| Pre-payment guarantee pursuant to the section 47 of the Housing Construction Act | 64 906 |
| Contractor guarantee pursuant to the section 12 of the Housing Construction Act | 865 393 |
| Other guarantees | 47 818 |
| Total | 2 131 518 |
Note 16 MAJOR ONE-OFF TRANSACTIONS
In 2025 the company purchased 50 per cent of Rabekkgata 4-6 A-S for NOK 65.6 million. In addition, the company sold its share of the joint venture company Kirkeveien Utbyggingsselskap AS in Ski to Urban Property Eier AS for NOK 44.4 million.